
Monitoring My Office Infrastructure Using Uptime Kuma
Back then, whenever one of our apps couldn’t be accessed, we had to manually figure out where the problem was coming from. Was it from the server? The database? The domain? Or the app itself? We had to check them one by one.
This process was a huge pain whenever multiple problems occured on the infrastructure. That’s when I thought “If only we had a tool that could instantly spot which service is down”. Initially, I had the idea to write Bash scripts by utilizing ping and curl to monitor the infrastructure. But while I was searching the internet, I came across an app called Uptime Kuma. This is exactly what I need.
What is Uptime Kuma?
Uptime Kuma is a self-hosted monitoring tool used to monitor the availability and health of infrastructure components like servers, databases, and websites. It works by periodically checking the services either by pinging, sending HTTP requests, or other methods. The moment a service goes down, the tool marks it as “DOWN” and logs the timestamp. It also has a notification system that can send alerts to most notification services. This app can be installed on any server to monitor any service accessible through the network.
Installing and Configuring Uptime Kuma
In our server room, we had an unused server that already has a static IP address. I decided to install Uptime Kuma there. There are two ways to install it: using Docker (I recommend you to use this method) or using Node.js directly. I chose the Node.js method. By following the installation guide on the GitHub page, I installed it using the following commands:
git clone https://github.com/louislam/uptime-kuma.git
cd uptime-kuma
npm run setup
Next, I started it using pm2 to run in the background and add it to cron:
pm2 start server/server.js --name uptime-kumaOnce the service was running, we opened the app (localhost:3001) via a browser to complete the setup. After configuring the login details, we began adding the services we needed to monitor: websites, servers, databases, and other external services.
How it helps us find problems faster
Over time, we added more services such as CCTV NVRs, network devices, and even our Building Management System (BMS) PC, which I occasionally need to access remotely to control the building operations. As of today, 21th July 2026, we have 27 monitored points.
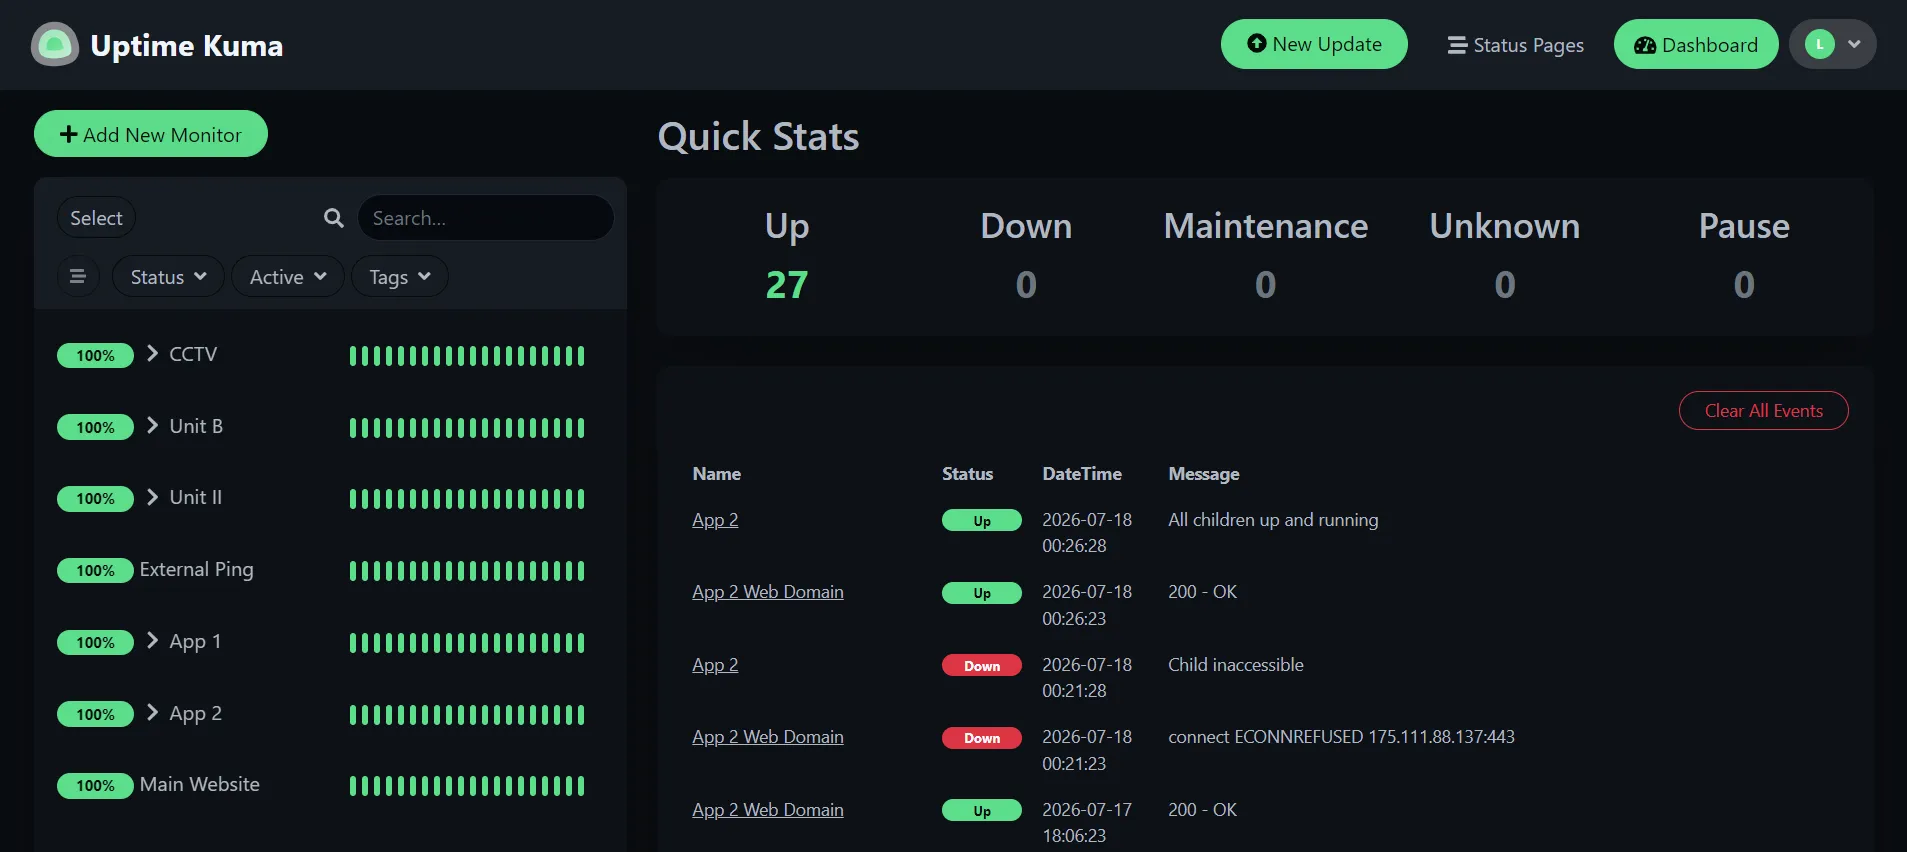
We finally able to monitor these centrally by only accessing Uptime Kuma, significantly reducing the time to troubleshoot when our apps went down. Now, the next time an app goes down, we check the availability status on Uptime Kuma. If the infrastructure shows “UP”, we know it is our code.
I also connected a notification system for some of the services to Discord since it is easy to setup via a webhook URL. If one goes down, the app instantly sends a notification to Discord.
Conclusion
Uptime Kuma has been a game-changer for us. It has helped us to monitor our infrastructure and applications more effectively, and has saved us a lot of time in troubleshooting problems. If you are still managing multiple services or apps by checking them one by one when they’re down, try setting up a self-hosted instance of Uptime Kuma. It’s definitely going to save you a lot of time!